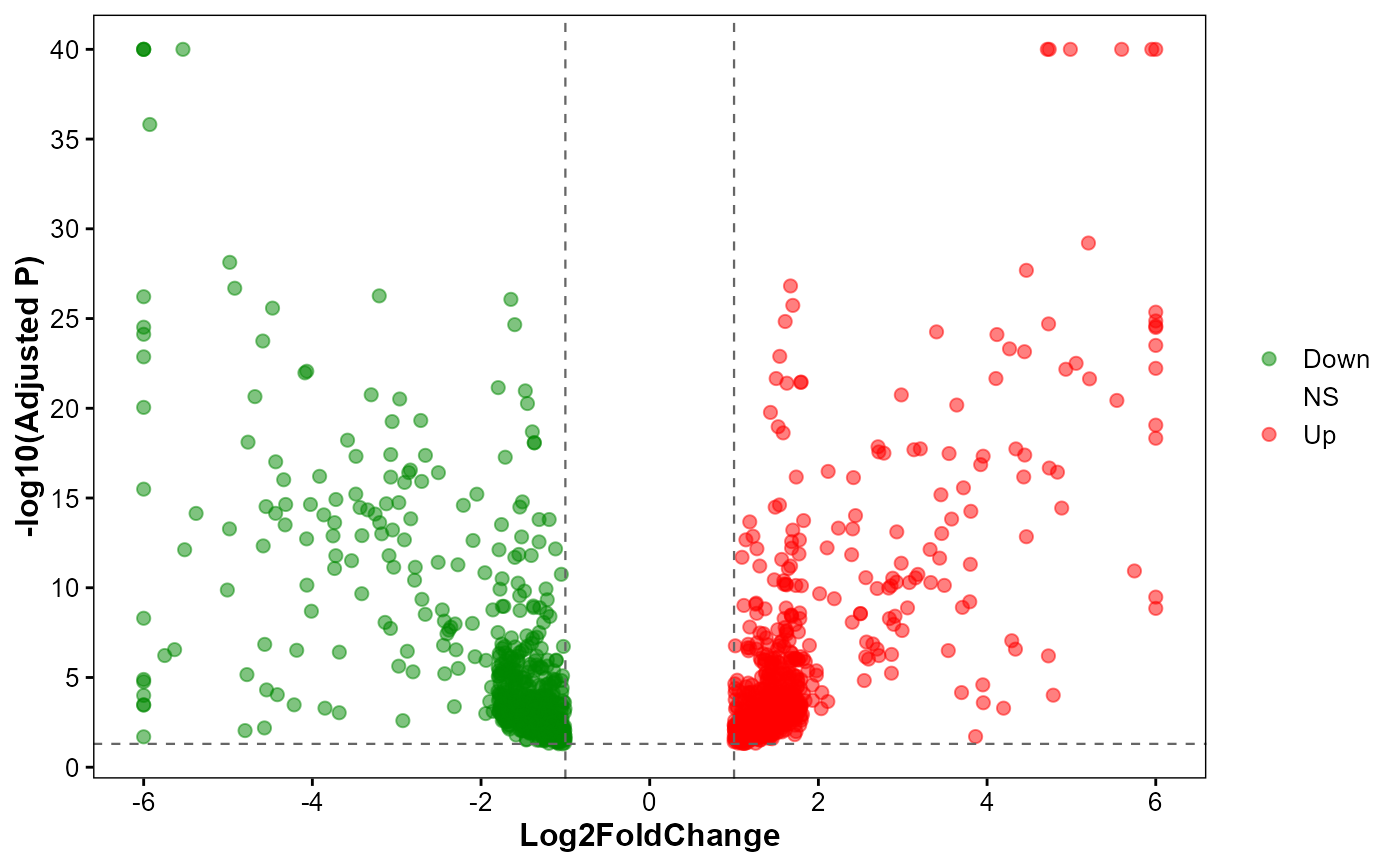
Plot differentially expressed genes (DEGs) volcano.
Usage
plot_deg_volcano(
  deg_file,
  id_col = "GeneID",
  fc_col = "log2FoldChange",
  sig_col = "padj",
  fc_threshold = 1,
  sig_threshold = 0.05,
  point_size = 2,
  point_alpha = 0.5,
  up_color = "#ff0000",
  down_color = "#008800",
  ns_color = "#888888"
)
Arguments
- deg_file
DEG table from DESeq2 analysis.
- id_col
Gene IDs column name. ("GeneID").
- fc_col
Log2(fold change) column name. ("log2FoldChange").
- sig_col
Significance column name. ("padj", "pvalue").
- fc_threshold
Absolute log2FC threshold. (1).
- sig_threshold
Significance threshold. (0.05).
- point_size
Point size. (2).
- point_alpha
Point alpha. (0.5).
- up_color
Color for up-regulated significant genes. ("#ff0000").
- down_color
Color for down-regulated significant genes. ("#008800").
- ns_color
Color for non-significant genes. ("#888888").
Examples
# DEG results from DESeq2
deg_file <- system.file(
  "extdata",
  "example.deg",
  package = "GAnnoViz")

# Volcano plot
plot_deg_volcano(
  deg_file = deg_file,
  id_col = "GeneID",
  fc_col = "log2FoldChange",
  sig_col = "padj",
  fc_threshold = 1,
  sig_threshold = 0.05,
  point_size = 2,
  point_alpha = 0.5,
  up_color = "#ff0000",
  down_color = "#008800",
  ns_color = "#888888"
)