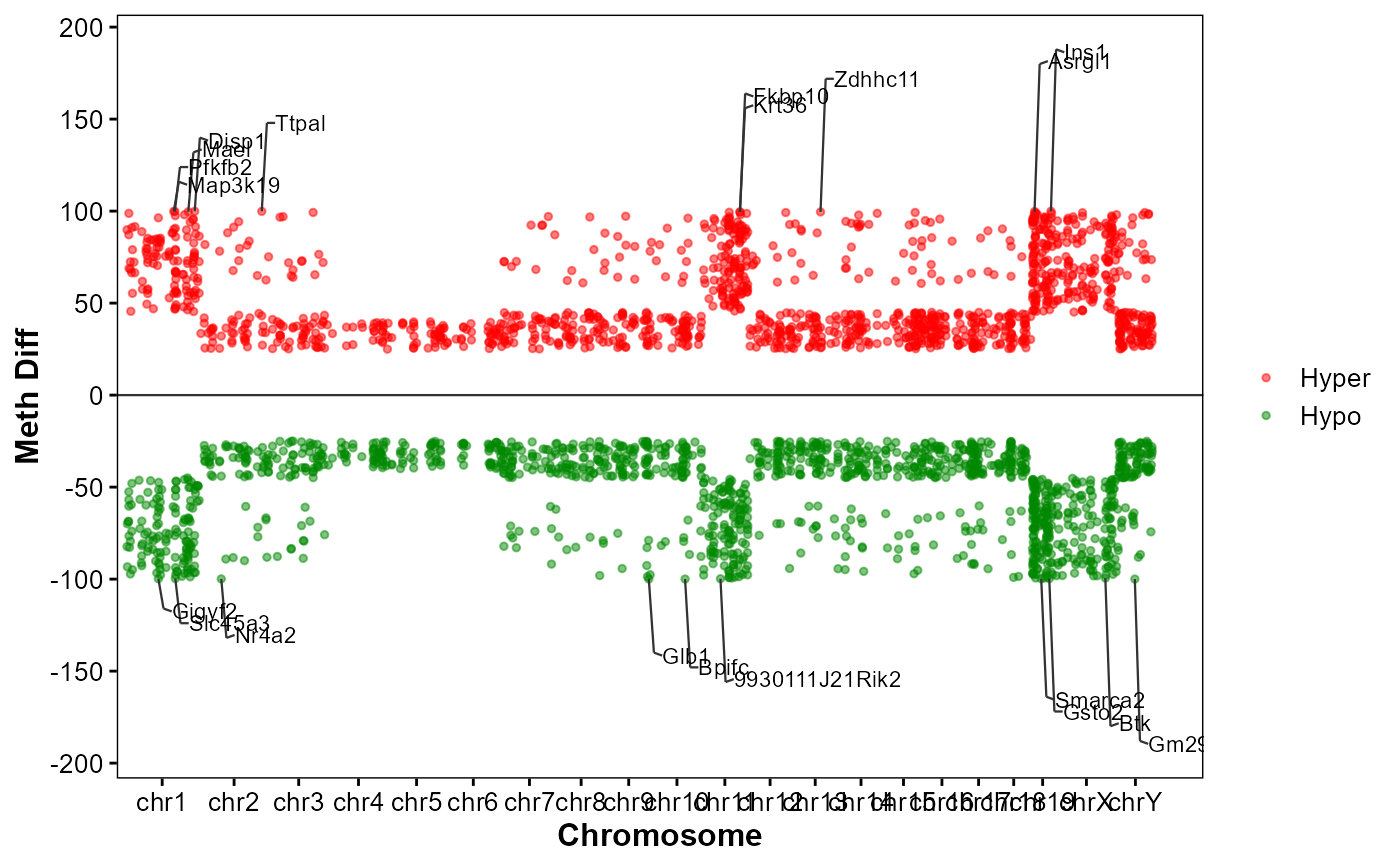
Plot genome-wide DMGs manhattan.
Usage
plot_dmg_manhattan(
  dmr_file,
  gff_file,
  format = "auto",
  gene_table = NULL,
  label_type = "name",
  label_col = NULL,
  y_transform = "none",
  chromosome_spacing = 1e+06,
  hyper_color = "#ff0000",
  hypo_color = "#008800",
  point_size = 1,
  point_alpha = 0.5,
  label_top_n = 10,
  label_size = 3,
  gap_frac = 0.04,
  connector_dx1 = NULL,
  connector_dx2 = NULL,
  connector_elbow = 0.8,
  connector_tilt_frac = 0.2
)
Arguments
- dmr_file
DEG table from MethylKit analysis.
- gff_file
Genomic structural annotation
GFF3/GTFfile path. If provided andlabel_colisNULL, will try to label by overlapped/nearestgene_id.- format
Format of GFF3/GTF file. ("auto", "gff3", "gtf").
- gene_table
Optional gene ID/name mapping table (first two columns: id, name). If provided, will use gene name for labels when possible.
- label_type
Label by gene name or gene id. ("name", "id"). If
"name"but no gene names can be inferred fromgff_file, please providegene_table.- label_col
Column name used for annotation labels. If
NULL, useschr:start-end.- y_transform
Y-axis transformation for
meth.diff. ("none", "log2", "log10").- chromosome_spacing
Gap width (bp) inserted between chromosomes on x-axis. (1e6).
- hyper_color
Color for hyper-methylated points. ("#ff0000").
- hypo_color
Color for hypo-methylated points. ("#008800").
- point_size
Point size. (1).
- point_alpha
Point alpha. (0.5).
- label_top_n
Number of top positive and top negative DMGs to label. (10).
- label_size
Text size for labels. (3).
- gap_frac
Minimum vertical gap between labels (fraction of y-range). (0.04).
- connector_dx1
First connector horizontal offset (bp). Default adapts to genome size.
- connector_dx2
Second connector horizontal offset (bp). Default adapts to genome size.
- connector_elbow
Scale factor applied to
connector_dx2. (0.8).- connector_tilt_frac
Tilt amplitude for the second connector segment as a fraction of
gap_frac. (0.2).
Examples
dmr_file <- system.file(
  "extdata",
  "example.dmr",
  package = "GAnnoViz")

gff_file <- system.file(
  "extdata",
  "example.gff3.gz",
  package = "GAnnoViz")

plot_dmg_manhattan(
  dmr_file = dmr_file,
  gff_file = gff_file,
  format = "auto",
  gene_table = NULL,
  label_type = "name",
  label_col = NULL,
  y_transform = "none",
  chromosome_spacing = 1e6,
  hyper_color = "#ff0000",
  hypo_color = "#008800",
  point_size = 1,
  point_alpha = 0.5,
  label_top_n = 10,
  label_size = 3,
  gap_frac = 0.04,
  connector_dx1 = NULL,
  connector_dx2 = NULL,
  connector_elbow = 0.8,
  connector_tilt_frac = 0.2
)
#> Import genomic features from the file as a GRanges object ...
#> OK
#> Prepare the 'metadata' data frame ...
#> OK
#> Make the TxDb object ...
#> OK