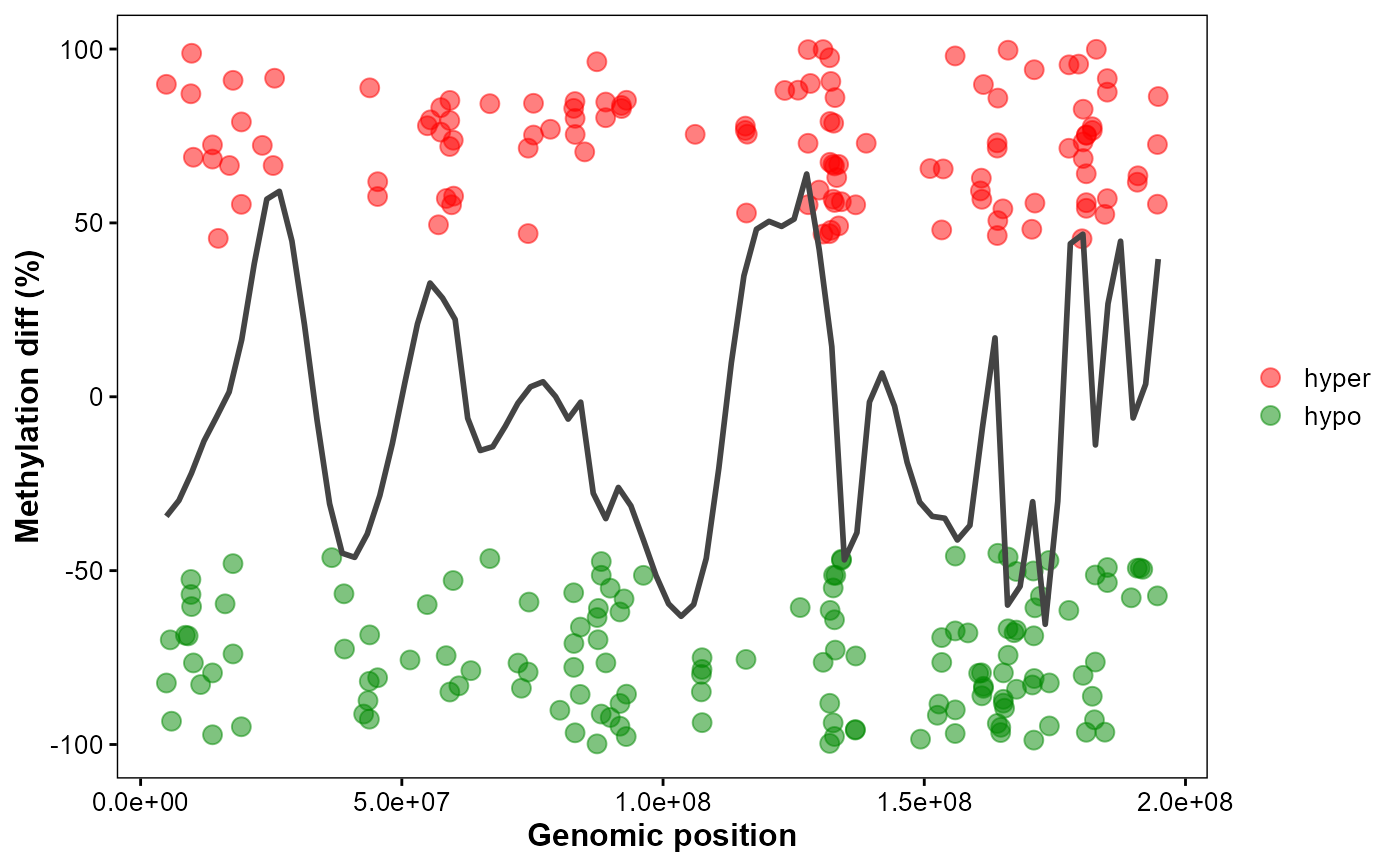
Plot chromosomal DMGs trend.
Usage
plot_dmg_trend(
  chrom_id,
  dmr_file,
  smooth_span = 0.1,
  hyper_color = "#ff000055",
  hypo_color = "#00880055",
  point_size = 3,
  point_alpha = 0.5
)
Arguments
- chrom_id
Chromosome identifier (e.g., "chr1").
- dmr_file
DEG table from MethylKit analysis.
- smooth_span
Span for local regression smoothing. (0.1).
- hyper_color
Color for hyper-methylated DMRs. ("#ff0000").
- hypo_color
Color for hypo-methylated DMRs. ("#008800").
- point_size
Point size. (3).
- point_alpha
Point alpha. (0.5).
Examples
# Example DMR table in GAnnoViz
dmr_file <- system.file(
  "extdata",
  "example.dmr",
  package = "GAnnoViz")

# Plot DMR trend
plot_dmg_trend(
  chrom_id = "chr1",
  dmr_file = dmr_file,
  smooth_span = 0.1,
  hyper_color = "#ff0000",
  hypo_color = "#008800",
  point_size = 3,
  point_alpha = 0.5
)
#> `geom_smooth()` using method = 'loess' and formula = 'y ~ x'