Plot protein domains from Ensembl.
Usage
plot_gene_domains(
  gene_name = NULL,
  species = "hsapiens",
  transcript_id = NULL,
  transcript_choice = "longest",
  palette = "Set 2",
  legend_ncol = 2,
  return_data = FALSE
)
Arguments
- gene_name
Official gene symbol. ("TP53").
- species
Species in BioMart format. ("hsapiens", "mmusculus").
- transcript_id
Ensembl transcript ID. ("ENST00000269305").
- transcript_choice
Transcript choice. ("longest", "canonical").
- palette
Color palette. ("Set 2", "Set 2", "Set 3", "Warm", "Cold", "Dynamic", "Viridis", "Plasma", "Inferno", "Rocket", "Mako").
- legend_ncol
Legend columns per row. (2).
- return_data
Plot and data. (TRUE).
Examples
# Plot TP53 domian
res <- plot_gene_domains(
gene_name = "TP53",
species = "hsapiens",
transcript_id = NULL,
transcript_choice = "longest",
palette = "Set 2",
legend_ncol = 2,
return_data = TRUE)
res$plot
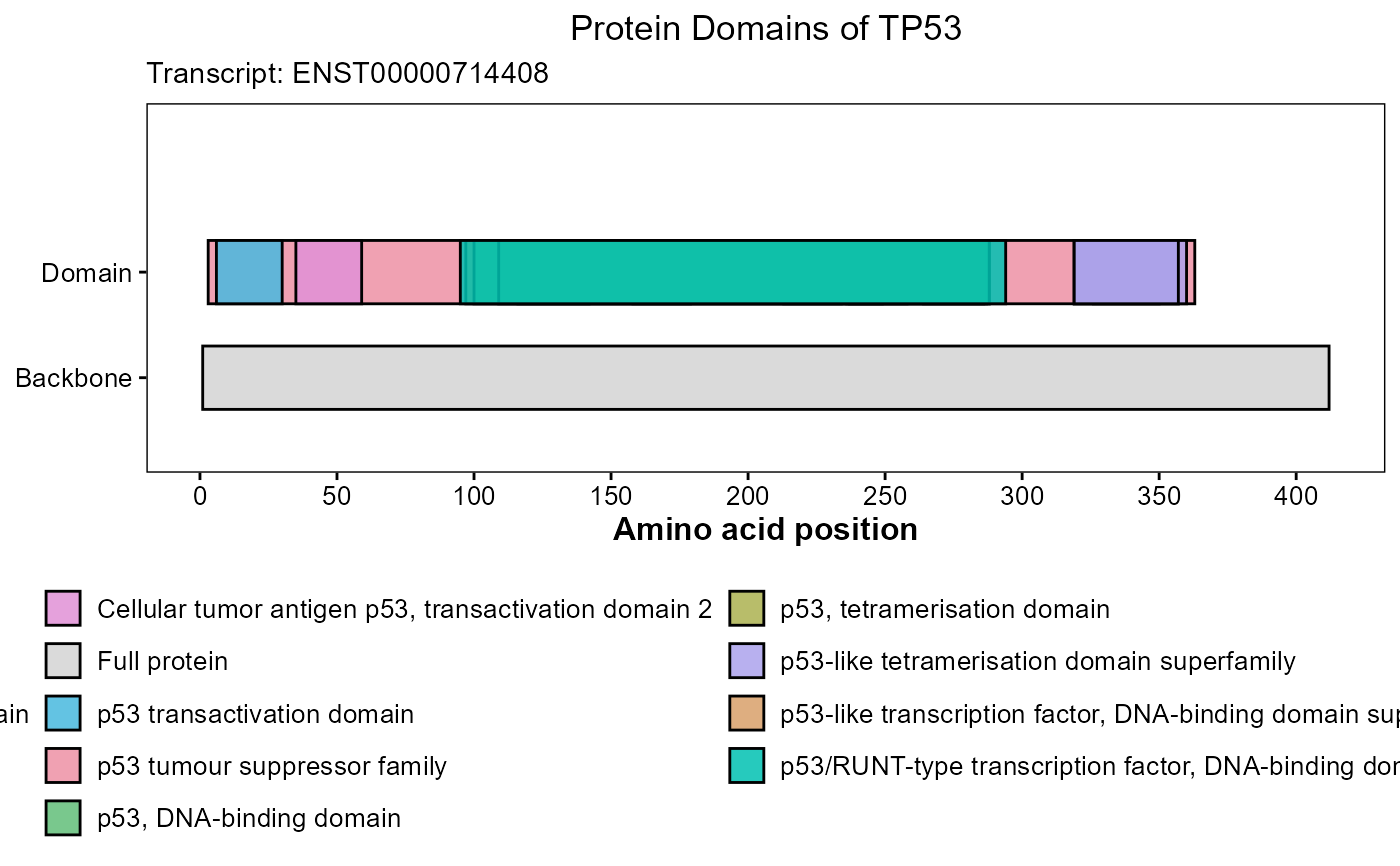 head(res$domain_data)
#> domain start end type
#> 1 p53 tumour suppressor family 116 142 domain
#> 2 p53 tumour suppressor family 158 179 domain
#> 3 p53 tumour suppressor family 213 234 domain
#> 4 p53 tumour suppressor family 236 258 domain
#> 5 p53 tumour suppressor family 264 286 domain
#> 6 p53 tumour suppressor family 326 350 domain
head(res$domain_data)
#> domain start end type
#> 1 p53 tumour suppressor family 116 142 domain
#> 2 p53 tumour suppressor family 158 179 domain
#> 3 p53 tumour suppressor family 213 234 domain
#> 4 p53 tumour suppressor family 236 258 domain
#> 5 p53 tumour suppressor family 264 286 domain
#> 6 p53 tumour suppressor family 326 350 domain