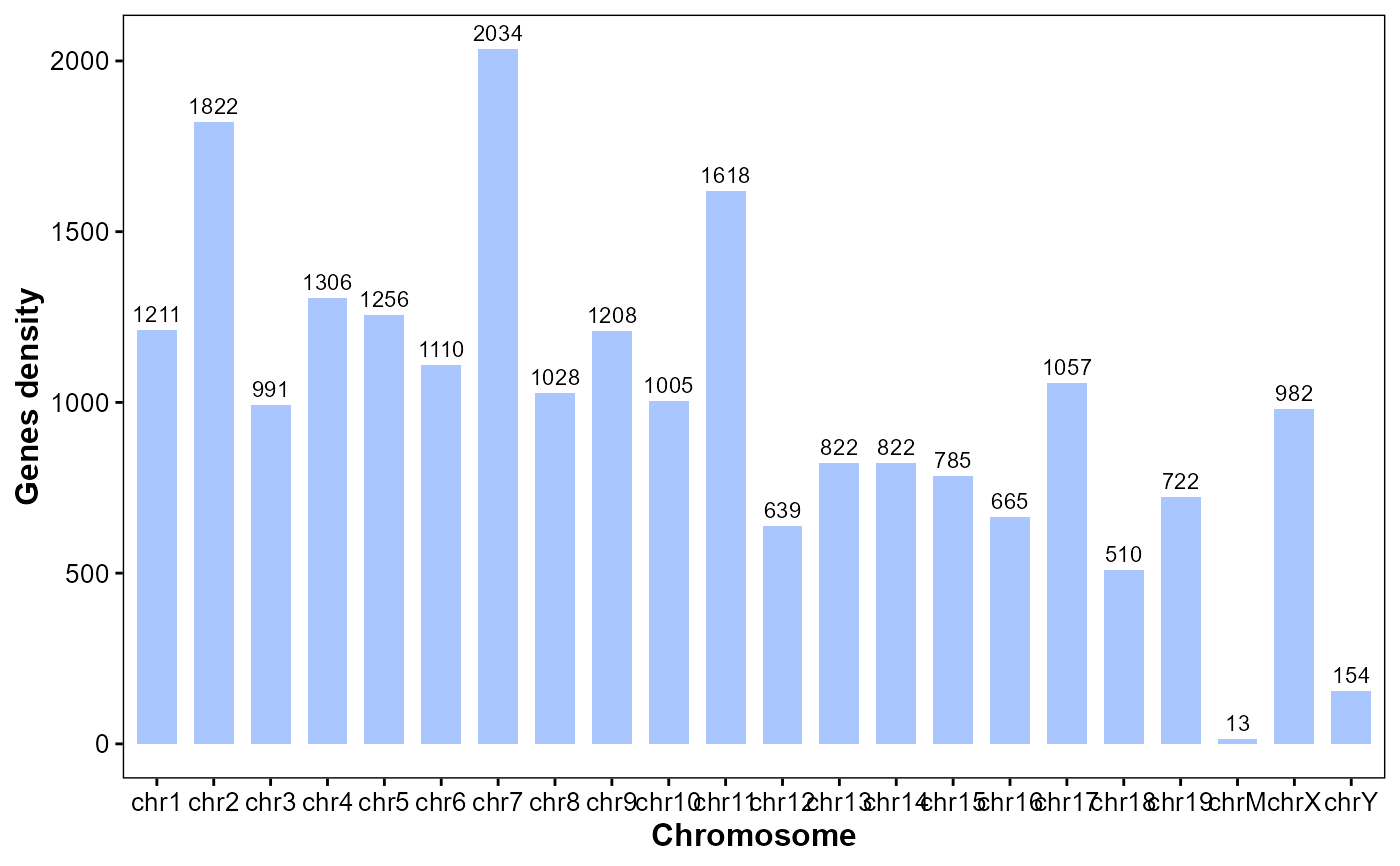
Plot gene stats for chromosomes.
Usage
plot_gene_stats(
  gff_file,
  format = "auto",
  bar_width = 0.7,
  bar_color = "#0055ff55",
  lable_size = 3
)Examples
# Example GFF3 file in GAnnoViz
gff_file <- system.file(
    "extdata",
    "example.gff3.gz",
    package = "GAnnoViz")

# Plot gene stats
plot_gene_stats(
    gff_file = gff_file,
    format = "auto",
    bar_width = 0.7,
    bar_color = "#0055ff55",
    lable_size = 3)
#> Import genomic features from the file as a GRanges object ...
#> OK
#> Prepare the 'metadata' data frame ...
#> OK
#> Make the TxDb object ...
#> OK