Gene neighborhood architecture around a focal gene
Source:R/plot_interval_flank.R
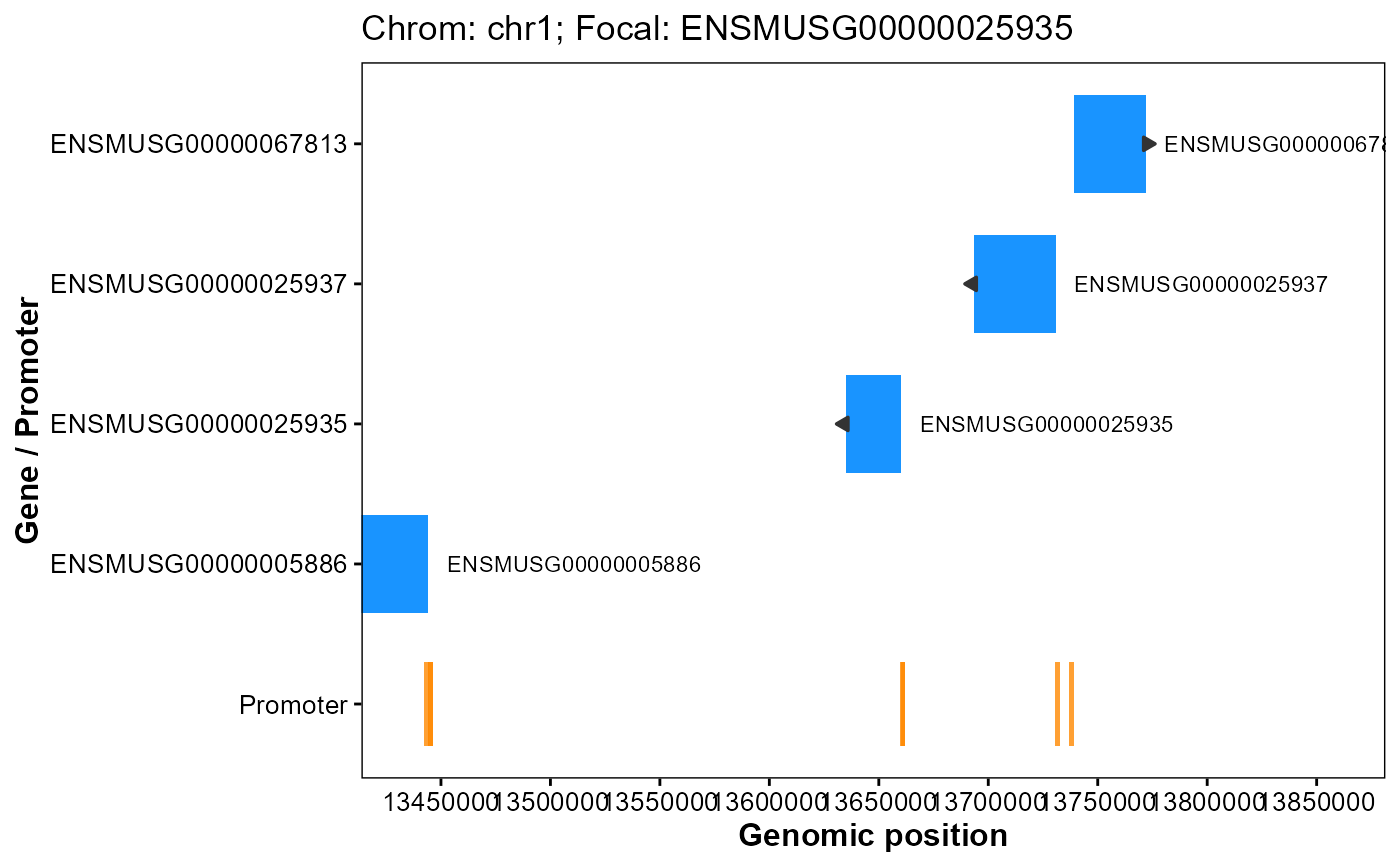
plot_interval_flank.RdPlot gene neighborhood around a focal gene with distances, arrows for strand, and optional promoter track.
Usage
plot_interval_flank(
  gff_file,
  format = "auto",
  gene_id,
  flank_upstream = 2e+05,
  flank_downstream = 2e+05,
  show_promoters = TRUE,
  upstream = 2000,
  downstream = 200,
  arrow_length = 5,
  arrow_unit = "pt",
  gene_color = "#0088ff",
  promoter_color = "#ff8800",
  label_size = 3
)
Arguments
- gff_file
Genomic structural annotation
GFF3/GTFfile path.- format
Format of GFF3/GTF file. ("auto", "gff3", "gtf").
- gene_id
Focal gene id consistent with GFF/GTF. (necessary).
- flank_upstream
Upstream flank window (bp). (200000).
- flank_downstream
Downstream flank window (bp). (200000).
- show_promoters
Whether to draw a promoter track. (TRUE).
- upstream
Promoter upstream (bp). (2000).
- downstream
Promoter downstream (bp). (200).
- arrow_length
Length of strand arrows (pt). (5).
- arrow_unit
Arrow length unit. ("pt", "mm").
- gene_color
Gene bar color. ("#0088ff").
- promoter_color
Promoter bar color. ("#ff8800").
- label_size
Label text size. (3).
Examples
# Example GFF3 file in GAnnoViz
gff_file <- system.file(
  "extdata",
  "example.gff3.gz",
  package = "GAnnoViz")

# Neighborhood around a focal gene on its chromosome
plot_interval_flank(
  gff_file = gff_file,
  format = "auto",
  gene_id = "ENSMUSG00000025935",
  flank_upstream = 200000,
  flank_downstream = 200000,
  show_promoters = TRUE,
  upstream = 2000,
  downstream = 200,
  arrow_length = 5,
  arrow_unit = "pt",
  gene_color = "#0088ff",
  promoter_color = "#ff8800",
  label_size = 3
)
#> Import genomic features from the file as a GRanges object ...
#> OK
#> Prepare the 'metadata' data frame ...
#> OK
#> Make the TxDb object ...
#> OK
#> Import genomic features from the file as a GRanges object ...
#> OK
#> Prepare the 'metadata' data frame ...
#> OK
#> Make the TxDb object ...
#> OK