Plot gene structures for a genomic interval
Source:R/plot_interval_structure.R
plot_interval_structure.RdPlot gene structures for a genomic interval.
Usage
plot_interval_structure(
  gff_file,
  format = "auto",
  chrom_id,
  start,
  end,
  x_breaks = 10,
  upstream = 2000,
  downstream = 200,
  feature_alpha = 0.8,
  intron_width = 1,
  arrow_count = 1,
  arrow_length = 5,
  arrow_unit = "pt",
  promoter_color = "#ff8800",
  utr5_color = "#008833",
  utr3_color = "#ff0033",
  exon_color = "#0033ff",
  intron_color = "#333333"
)
Arguments
- gff_file
Genomic structural annotation
GFF3/GTFfile path.- format
Format of GFF3/GTF file. ("auto", "gff3", "gtf").
- chrom_id
Chromosome id (must match the annotation).
- start
Window start coordinate (bp, genomic absolute coordinate).
- end
Window end coordinate (bp, genomic absolute coordinate).
- x_breaks
X axis breaks number. (10).
- upstream
Promoter upstream (bp). (2000).
- downstream
Promoter downstream (bp). (200).
- feature_alpha
Elements alpha. (0.8).
- intron_width
Intron line width. (1).
- arrow_count
Intron arrow number bold. (1).
- arrow_length
Intron arrows length(pt). (1).
- arrow_unit
Intron arrow length unit. ("pt", "mm").
- promoter_color
Promoter color. ("#ff8800").
- utr5_color
5'UTR color. ("#008833").
- utr3_color
3'UTR color. ("#ff0033").
- exon_color
Exon color. ("#0033ff").
- intron_color
Intron color. ("#333333").
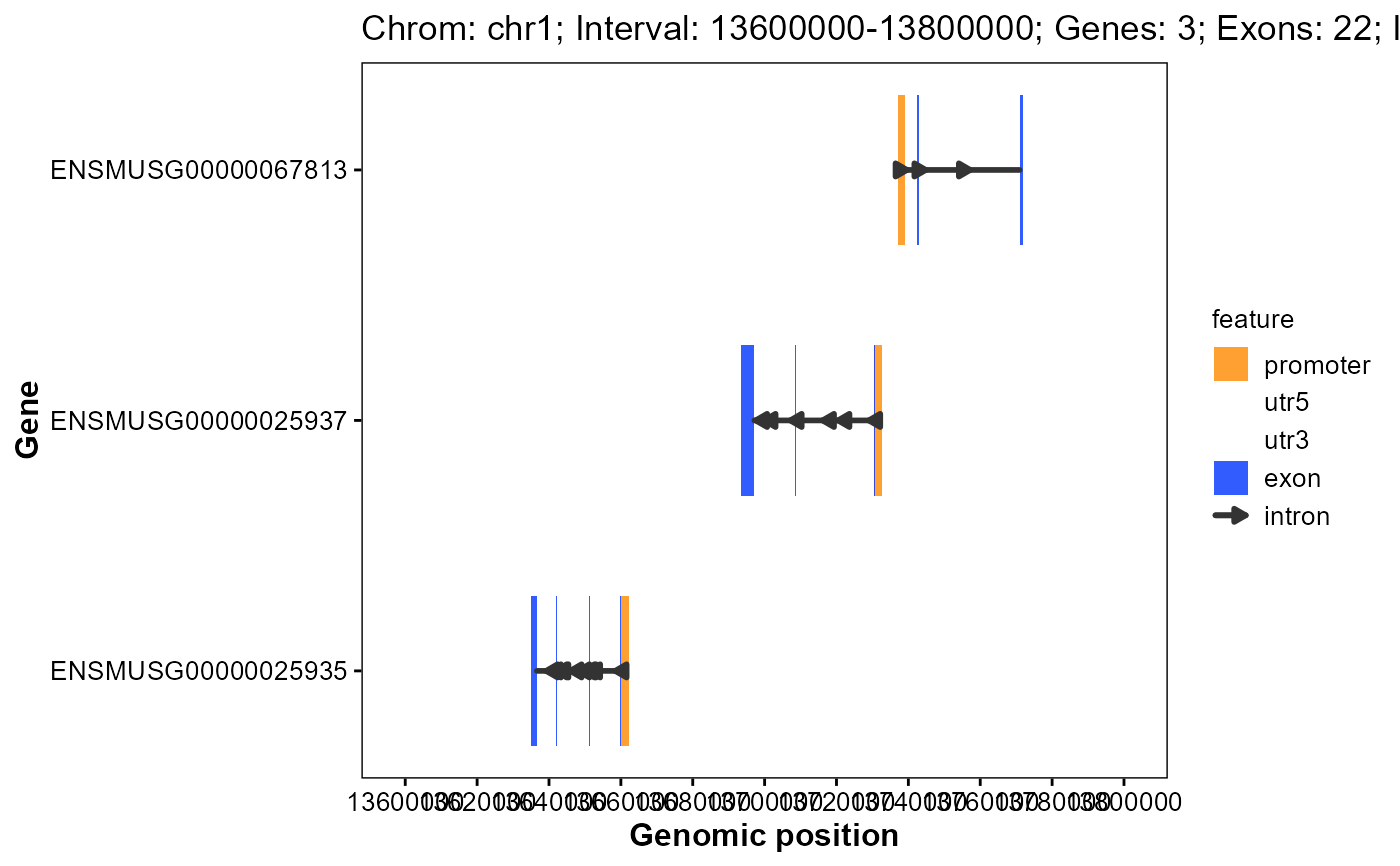
Examples
# Example GFF3 file in GAnnoViz
gff_file <- system.file(
  "extdata",
  "example.gff3.gz",
  package = "GAnnoViz")

plot_interval_structure(
  gff_file = gff_file,
  format = "auto",
  chrom_id = "chr1",
  start = 13600000,
  end = 13800000,
  x_breaks = 10,
  upstream = 2000,
  downstream = 200,
  feature_alpha = 0.8,
  intron_width = 1,
  arrow_count = 1,
  arrow_length = 5,
  arrow_unit = "pt",
  promoter_color = "#ff8800",
  utr5_color = "#008833",
  utr3_color = "#ff0033",
  exon_color = "#0033ff",
  intron_color = "#333333"
)
#> Import genomic features from the file as a GRanges object ...
#> OK
#> Prepare the 'metadata' data frame ...
#> OK
#> Make the TxDb object ...
#> OK