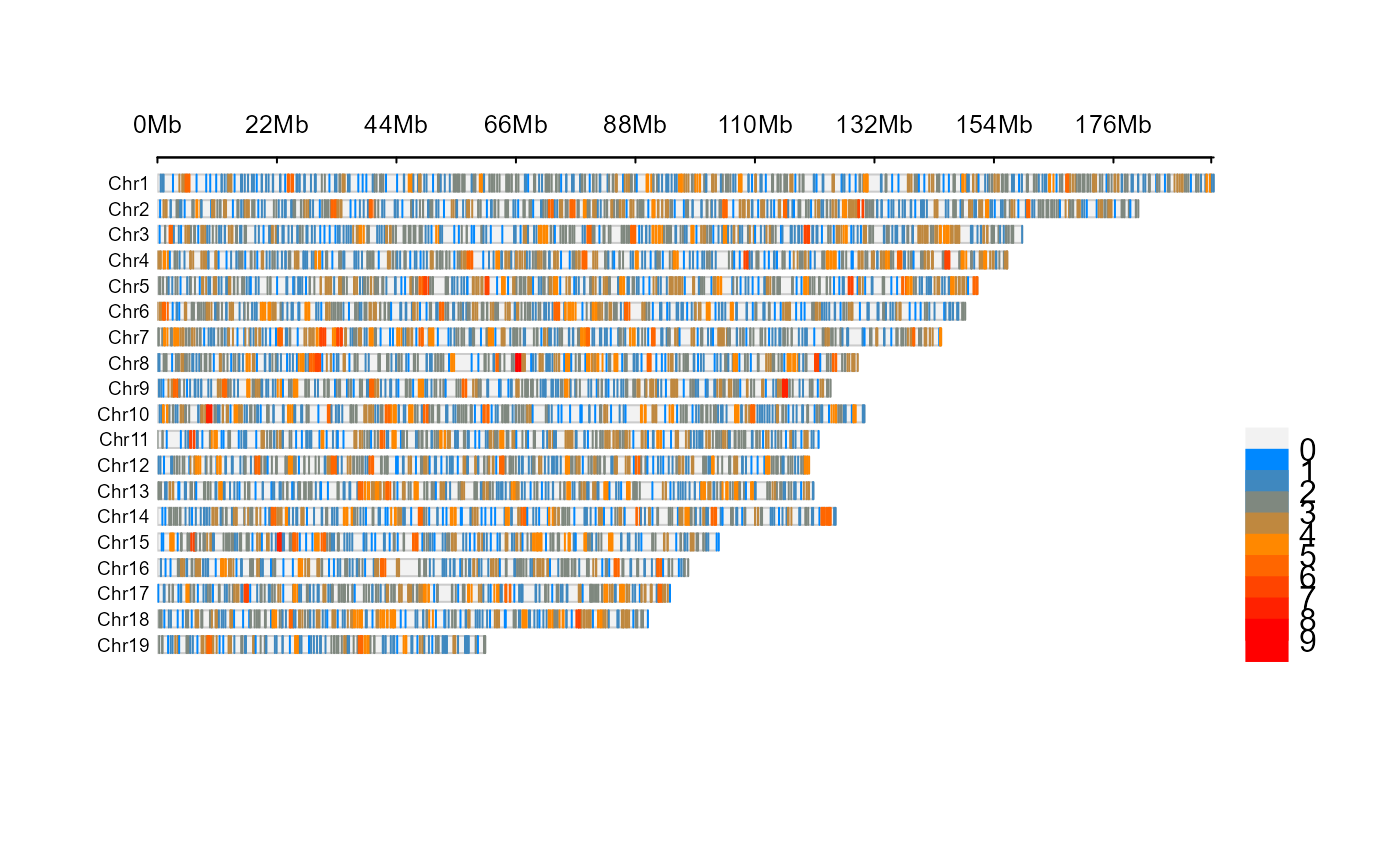
Plot SNP density at chromosome level.
Usage
plot_snp_density(
  fst_file,
  LOG10 = FALSE,
  bin_size = 1e+06,
  density_color = c("#0088ff", "#ff8800", "#ff0000")
)Examples
# Example data in GAnnoViz
fst_file <- system.file(
  "extdata",
  "example.fst",
  package = "GAnnoViz")

# Plot SNP density
plot_snp_density(
  fst_file = fst_file,
  LOG10 = FALSE,
  bin_size = 1e6,
  density_color = c("#0088ff", "#ff8800", "#ff0000")
)
#> Warning: There was 1 warning in `dplyr::mutate()`.
#> ℹ In argument: `CHROM = as.numeric(gsub("chr", "", CHROM))`.
#> Caused by warning:
#> ! NAs introduced by coercion