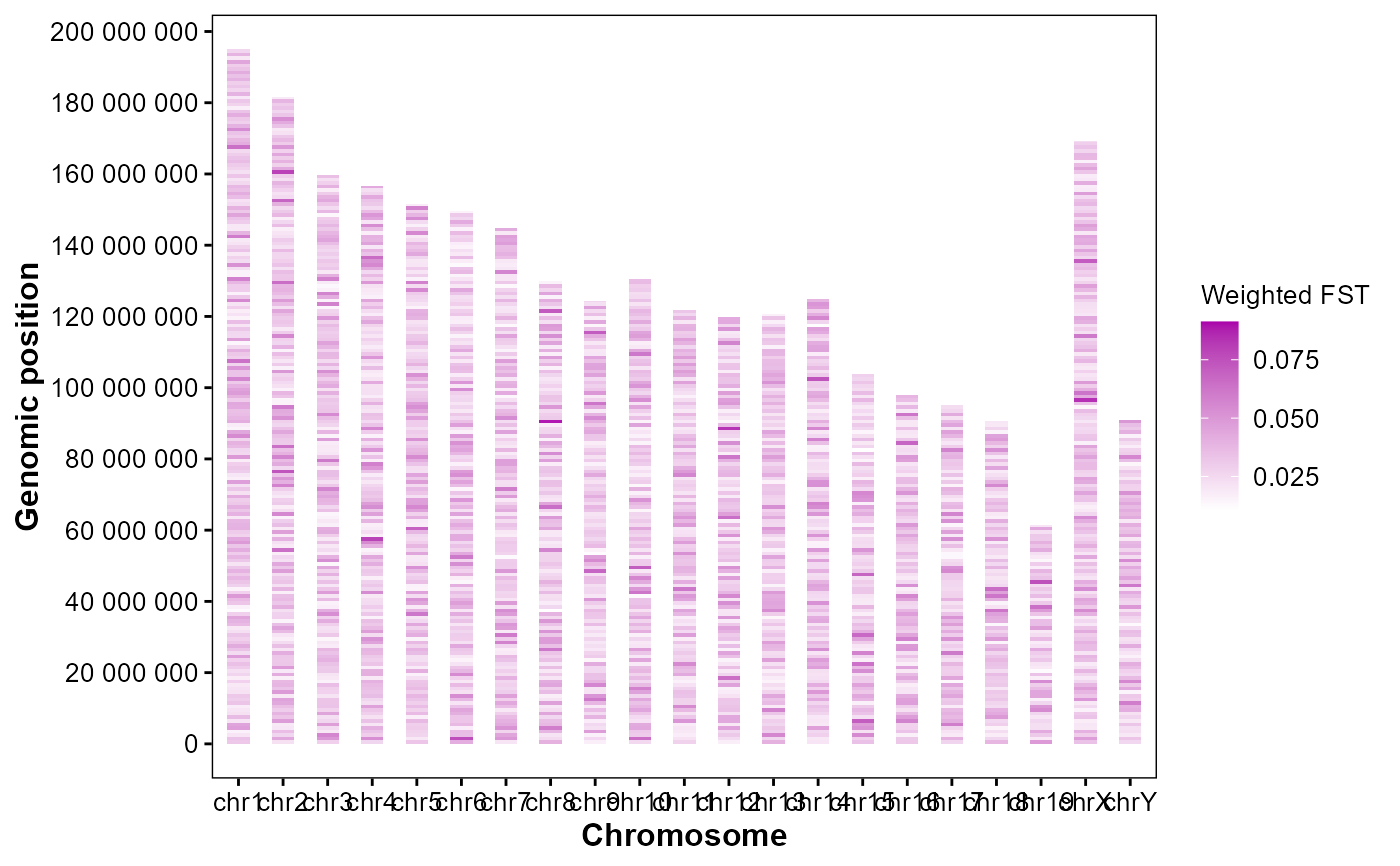
Plot genomic weighted FST heatmap.
Usage
plot_snp_fst(
  fst_file,
  bin_size = 1e+06,
  metric = "fst_mean",
  orientation = "horizontal",
  palette = c("#ffffff", "#aa00aa"),
  alpha = 0.9
)
Arguments
- fst_file
FST sliding window results. (CHROM, BIN_START, BIN_END, WEIGHTED_FST, N_VARIANTS.
- bin_size
Bin size in base pairs. (1e6).
- metric
Aggregation metric for bin fill. ("fst_mean", "variant_count").
- orientation
Coordinate orientation. ("horizontal", "vertical").
- palette
Continuous color for weighted FST. (c("#ffffff", "#aa00aa")).
- alpha
Tile alpha for heatmap. (0.9).
Examples
# Example FST sliding window table in GAnnoViz
fst_file <- system.file(
  "extdata",
  "example.fst",
  package = "GAnnoViz")

# Plot weighted FST
plot_snp_fst(
  fst_file = fst_file,
  bin_size = 1e6,
  metric = "fst_mean",
  orientation = "horizontal",
  palette = c("#ffffff", "#aa00aa"),
  alpha = 0.9
)
#> Coordinate system already present.
#> ℹ Adding new coordinate system, which will replace the existing one.