Generate a Seurat object with basic preprocessing (DefaultAssay, PercentageFeatureSet, NormalizeData, FindVariableFeatures, ScaleData, RunPCA, FindNeighbors, FindClusters, RunUMAP).
Usage
SeuratVisProExample(
  n_cells = 300,
  n_genes = 1000,
  n_clusters = 10,
  seed = 123,
  genes_mt = "^MT-",
  neighbor_dims = 10,
  cluster_res = 0.5,
  umap_dims = 10,
  spatial = FALSE
)
Arguments
- n_cells
Number of cells. Default:
300.- n_genes
Number of genes. Default:
1000.- n_clusters
Number of clusters. Default:
10.- seed
Random seed for reproducibility. Default:
123.- genes_mt
Regex for mitochondrial genes. Default:
"^MT-".- neighbor_dims
Neighbor graph dimensions used in
FindNeighbors. Default:10.- cluster_res
Cluster resolution used in
FindClusters. Default:0.5.- umap_dims
UMAP dimensions used in
RunUMAP. Default:10.- spatial
Whether to add synthetic spatial coordinates
x,ytometa.data. Default:FALSE.
Examples
obj <- SeuratVisProExample(
    n_cells = 300,
    n_genes = 1000,
    n_clusters = 10,
    seed = 123,
    genes_mt = "^MT-",
    neighbor_dims = 10,
    cluster_res = 0.5,
    umap_dims = 10,
    spatial = FALSE)
#> Modularity Optimizer version 1.3.0 by Ludo Waltman and Nees Jan van Eck
#>
#> Number of nodes: 300
#> Number of edges: 4508
#>
#> Running Louvain algorithm...
#> Maximum modularity in 10 random starts: 0.9485
#> Number of communities: 10
#> Elapsed time: 0 seconds
#> Warning: The default method for RunUMAP has changed from calling Python UMAP via reticulate to the R-native UWOT using the cosine metric
#> To use Python UMAP via reticulate, set umap.method to 'umap-learn' and metric to 'correlation'
#> This message will be shown once per session

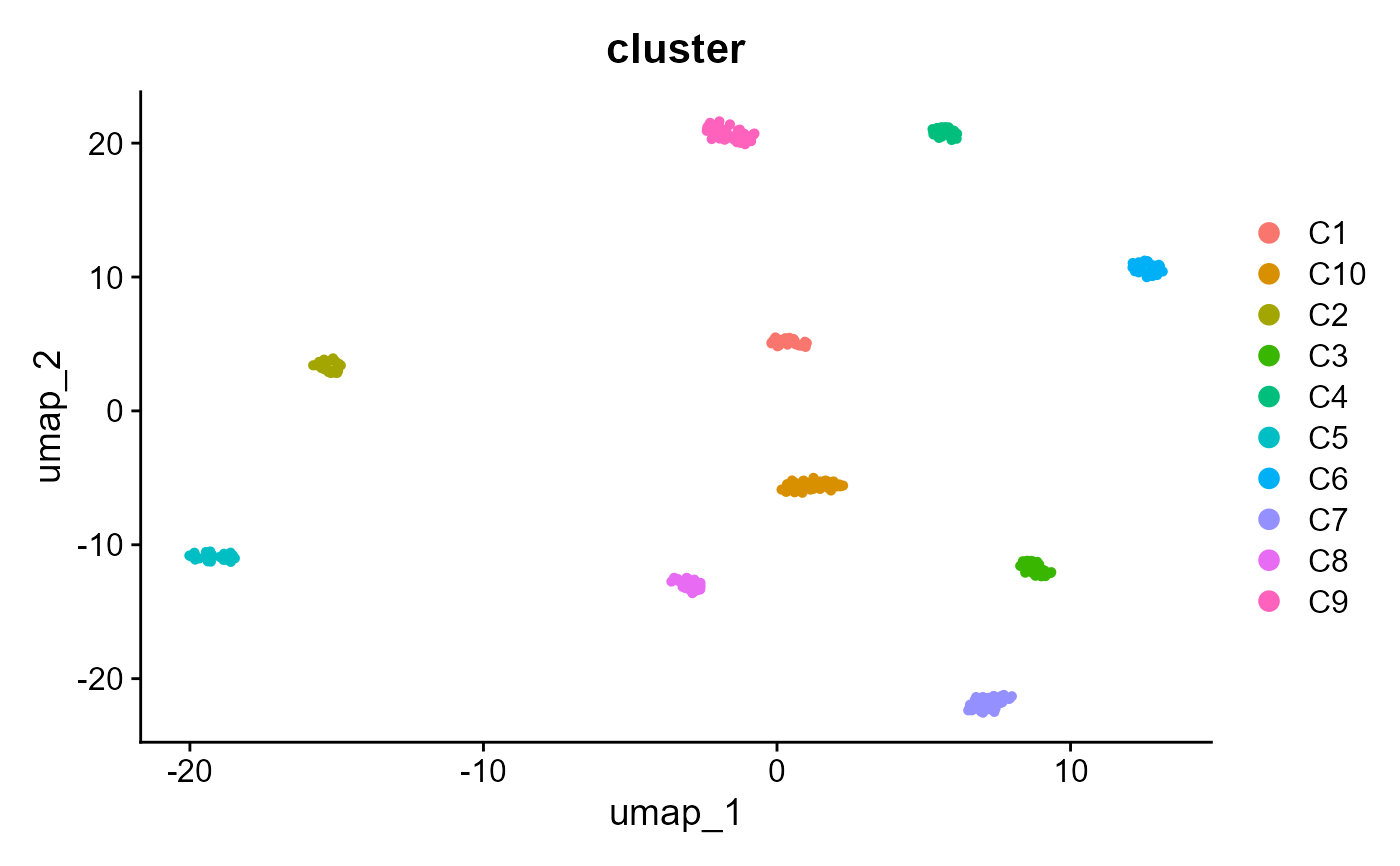
Seurat::DimPlot(obj, group.by = "cluster")