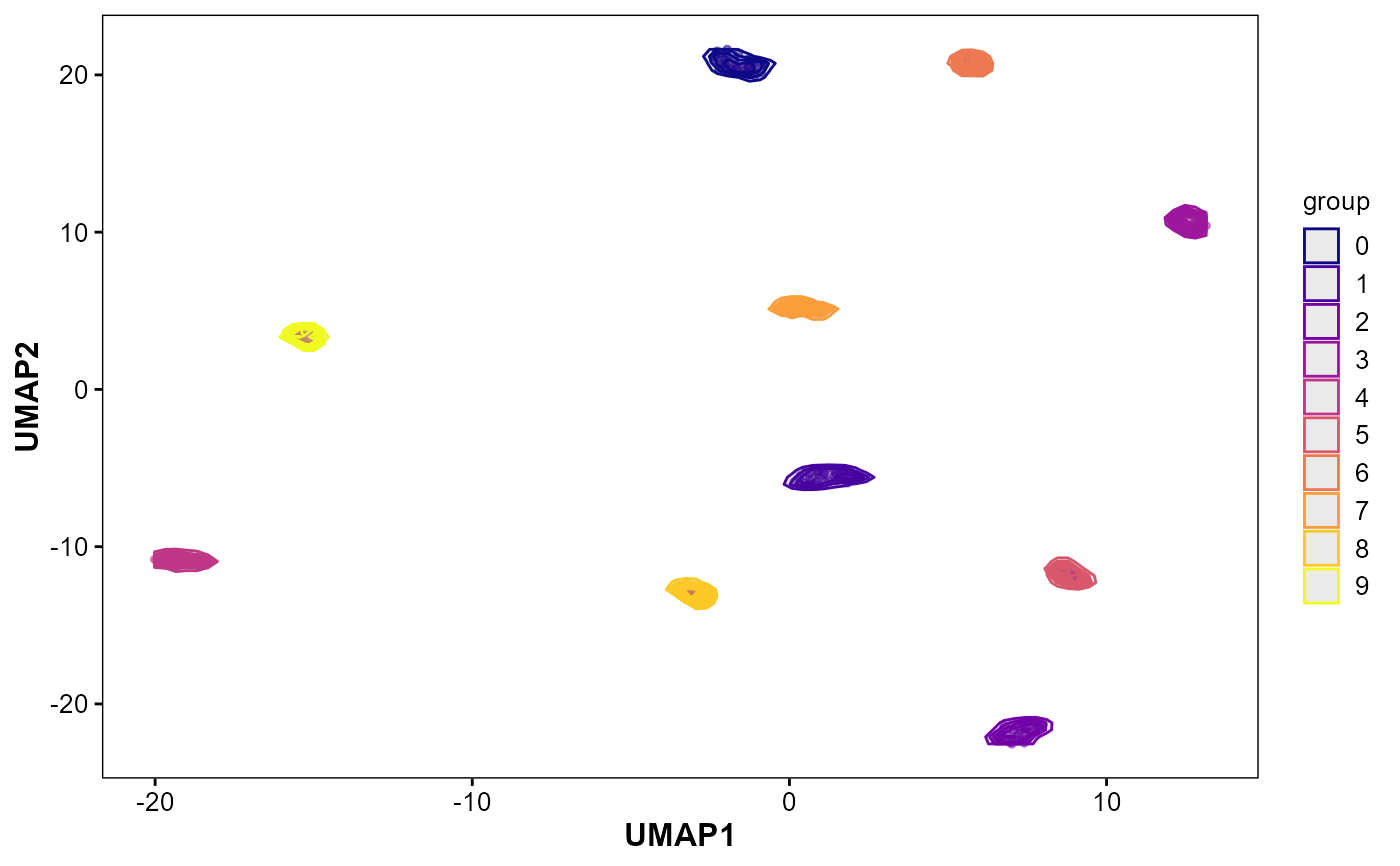
Overlay 2D density contours for groups on UMAP/PCA to highlight boundaries.
Usage
VisEmbeddingContour(
  object,
  group.by = "seurat_clusters",
  reduction = "umap",
  levels = 5,
  palette = "C",
  point_size = 1,
  point_alpha = 0.5,
  contour_alpha = 0.1
)
Arguments
- object
A
Seuratobject; UMAP/PCA is computed when absent.- group.by
Metadata column for grouping. Default:
"seurat_clusters".- reduction
Reduction name (
'umap'or'pca'). Default:'umap'.- levels
Number of contour levels. Default:
5.- palette
Viridis palette option for color/fill. Default:
"C".- point_size
Point size. Default:
1.- point_alpha
Point alpha. Default:
0.5.- contour_alpha
Contour alpha. Default:
0.1.
Examples
obj <- SeuratVisProExample(
    n_cells = 300,
    n_genes = 1000,
    n_clusters = 10,
    seed = 123,
    genes_mt = "^MT-",
    neighbor_dims = 10,
    cluster_res = 0.5,
    umap_dims = 10,
    spatial = FALSE)
#> Modularity Optimizer version 1.3.0 by Ludo Waltman and Nees Jan van Eck
#>
#> Number of nodes: 300
#> Number of edges: 4508
#>
#> Running Louvain algorithm...
#> Maximum modularity in 10 random starts: 0.9485
#> Number of communities: 10
#> Elapsed time: 0 seconds

p <- VisEmbeddingContour(
  obj,
  group.by = "seurat_clusters",
  reduction = "umap",
  levels = 5,
  palette = "C",
  point_size = 1,
  point_alpha = 0.5,
  contour_alpha = 0.1)
p