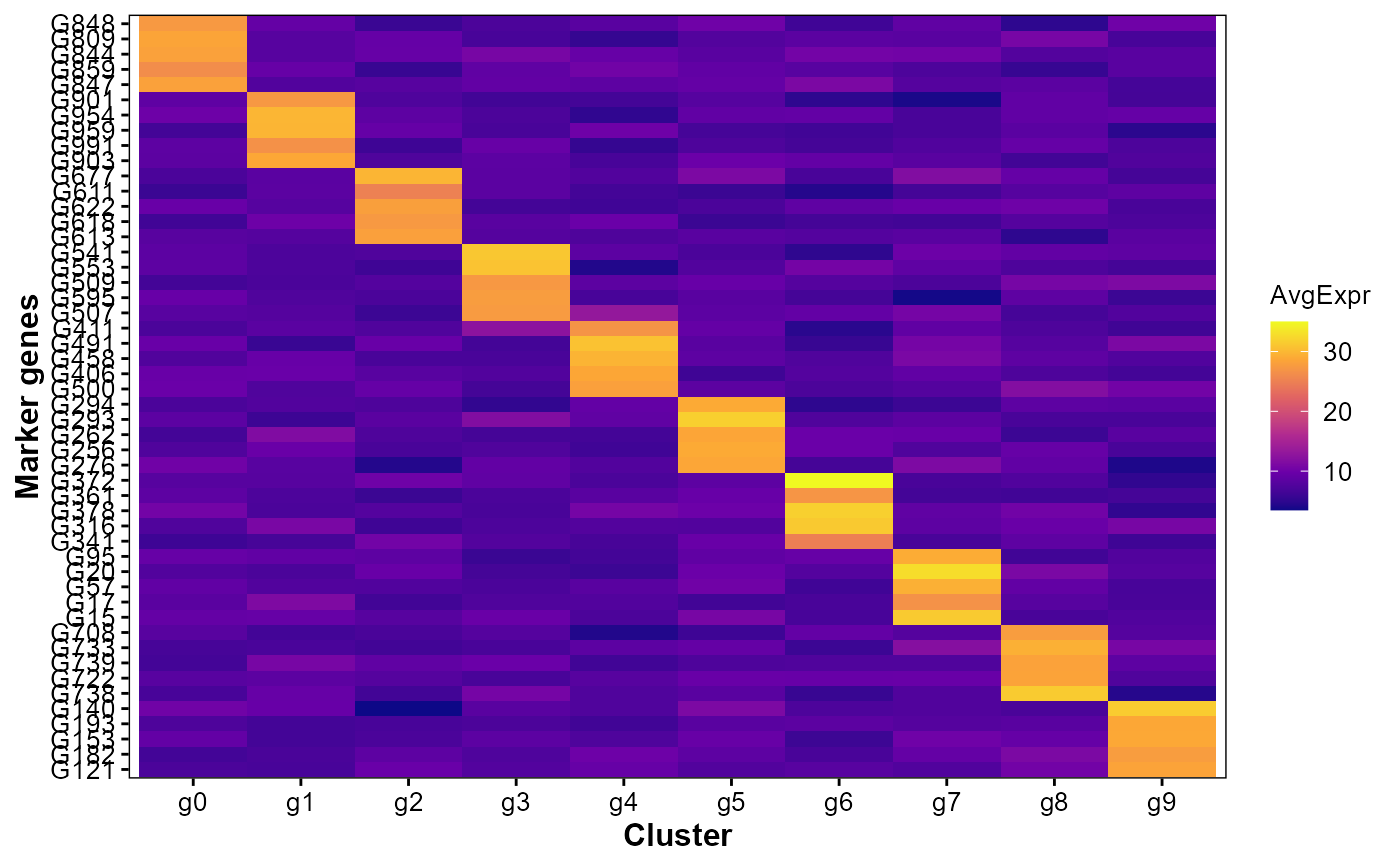
Find top markers per cluster and visualize as a heatmap.
Usage
VisMarkerAtlas(
  object,
  markers_top = 5,
  logfc_threshold = 0.25,
  min_percent = 0.1,
  test_method = "wilcox",
  palette = "C"
)
Arguments
- object
A
Seuratobject; required.- markers_top
Number of top markers per cluster. Default:
5.- logfc_threshold
Log fold-change threshold for marker finding. Default:
0.25.- min_percent
Minimum percent expressed. Default:
0.1.- test_method
Differential test method, e.g.,
'wilcox','t','LR'. Default:'wilcox'.- palette
Viridis palette option for color/fill. Default:
"C".
Examples
obj <- SeuratVisProExample(
n_cells = 300,
n_genes = 1000,
n_clusters = 10,
seed = 123,
genes_mt = "^MT-",
neighbor_dims = 10,
cluster_res = 0.5,
umap_dims = 10,
spatial = FALSE)
#> Modularity Optimizer version 1.3.0 by Ludo Waltman and Nees Jan van Eck
#>
#> Number of nodes: 300
#> Number of edges: 4508
#>
#> Running Louvain algorithm...
#> Maximum modularity in 10 random starts: 0.9485
#> Number of communities: 10
#> Elapsed time: 0 seconds
res <- VisMarkerAtlas(
obj,
markers_top = 5,
logfc_threshold = 0.25,
min_percent = 0.1,
test_method = "wilcox",
palette = "C")
#> Calculating cluster 0
#> For a (much!) faster implementation of the Wilcoxon Rank Sum Test,
#> (default method for FindMarkers) please install the presto package
#> --------------------------------------------
#> install.packages('devtools')
#> devtools::install_github('immunogenomics/presto')
#> --------------------------------------------
#> After installation of presto, Seurat will automatically use the more
#> efficient implementation (no further action necessary).
#> This message will be shown once per session
#> Calculating cluster 1
#> Calculating cluster 2
#> Calculating cluster 3
#> Calculating cluster 4
#> Calculating cluster 5
#> Calculating cluster 6
#> Calculating cluster 7
#> Calculating cluster 8
#> Calculating cluster 9
res$plot
 head(res$markers)
#> # A tibble: 6 × 7
#> p_val avg_log2FC pct.1 pct.2 p_val_adj cluster gene
#> <dbl> <dbl> <dbl> <dbl> <dbl> <fct> <chr>
#> 1 9.50e-19 1.80 1 0.622 9.50e-16 0 G848
#> 2 1.86e-17 1.83 0.976 0.622 1.86e-14 0 G809
#> 3 1.92e-17 1.62 1 0.653 1.92e-14 0 G844
#> 4 3.46e-17 1.69 1 0.653 3.46e-14 0 G859
#> 5 3.79e-17 1.73 0.976 0.653 3.79e-14 0 G847
#> 6 5.19e-19 1.97 1 0.563 5.19e-16 1 G901
head(res$markers)
#> # A tibble: 6 × 7
#> p_val avg_log2FC pct.1 pct.2 p_val_adj cluster gene
#> <dbl> <dbl> <dbl> <dbl> <dbl> <fct> <chr>
#> 1 9.50e-19 1.80 1 0.622 9.50e-16 0 G848
#> 2 1.86e-17 1.83 0.976 0.622 1.86e-14 0 G809
#> 3 1.92e-17 1.62 1 0.653 1.92e-14 0 G844
#> 4 3.46e-17 1.69 1 0.653 3.46e-14 0 G859
#> 5 3.79e-17 1.73 0.976 0.653 3.79e-14 0 G847
#> 6 5.19e-19 1.97 1 0.563 5.19e-16 1 G901