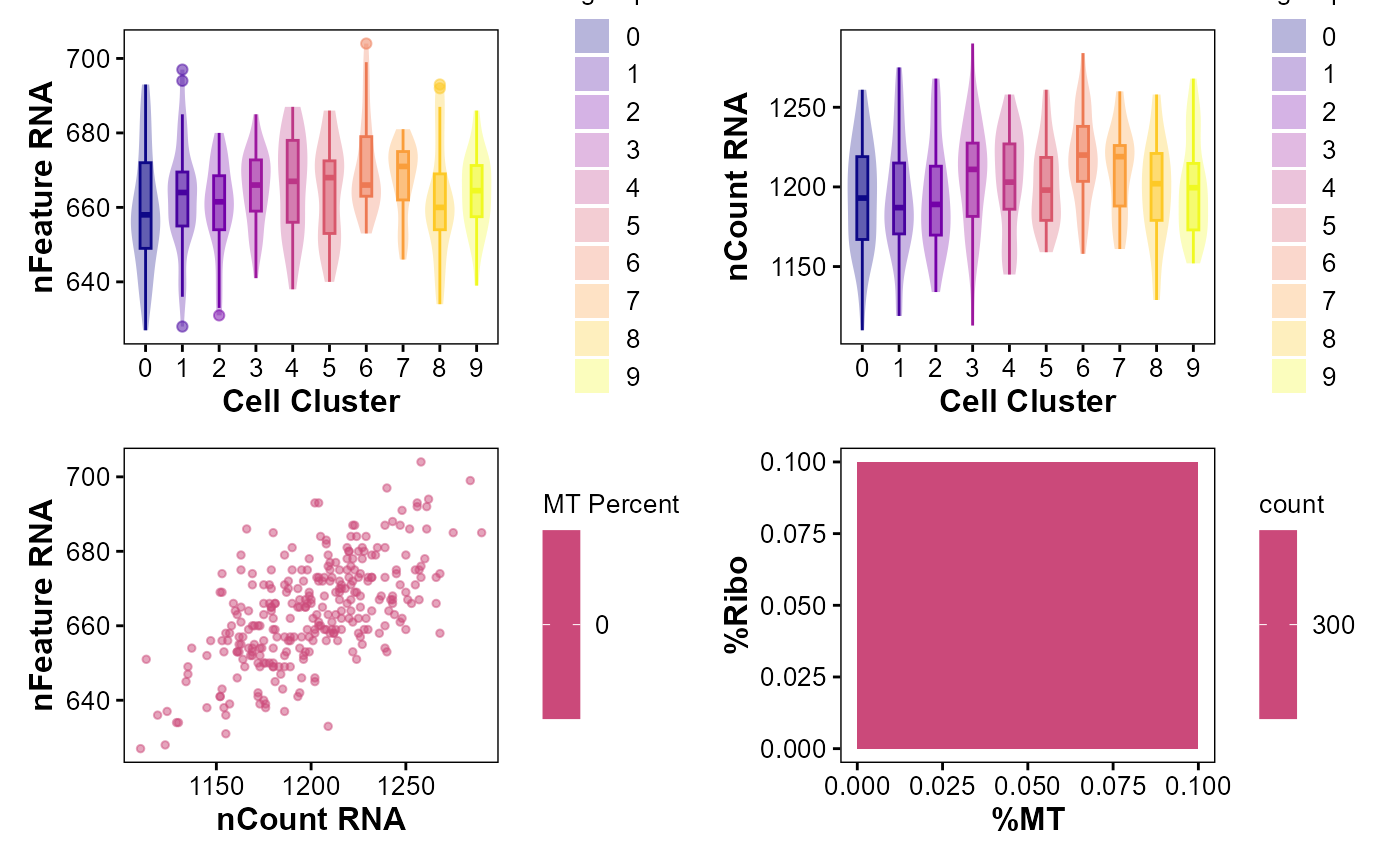
Visualize key QC metrics with customizable thresholds and optional interactivity.
Usage
VisQCPanel(
  object,
  assay = NULL,
  genes_mt = "^MT-",
  genes_ribo = "^RPL|^RPS",
  group.by = NULL,
  interactive = FALSE,
  palette = "C",
  violin_width = 0.8,
  violin_alpha = 0.3,
  box_width = 0.3,
  box_alpha = 0.5
)
Arguments
- object
A
Seuratobject; required.- assay
Assay name to use. Default:
Seurat::DefaultAssay(object).- genes_mt
Regex for mitochondrial genes. Default:
"^MT-".- genes_ribo
Regex for ribosomal genes (e.g.,
"^RPL|^RPS"). Default:NULL(skip ribosomal panel whenNULL).- group.by
Column in
object@meta.dataused for grouping. Default:"seurat_clusters"if present, else identities or a single group.- interactive
Whether to return interactive plots via
plotly::ggplotly. Default:FALSE.- palette
Viridis palette option for color/fill. Default:
"C". Allowed:"A"–"H".- violin_width
Width of violin geoms. Default:
0.8.- violin_alpha
Alpha of violin geoms. Default:
0.3.- box_width
Width of boxplot geoms. Default:
0.3.- box_alpha
Alpha of boxplot geoms. Default:
0.5.
Examples
obj <- SeuratVisProExample(
    n_cells = 300,
    n_genes = 1000,
    n_clusters = 10,
    seed = 123,
    genes_mt = "^MT-",
    neighbor_dims = 10,
    cluster_res = 0.5,
    umap_dims = 10,
    spatial = FALSE)
#> Modularity Optimizer version 1.3.0 by Ludo Waltman and Nees Jan van Eck
#>
#> Number of nodes: 300
#> Number of edges: 4508
#>
#> Running Louvain algorithm...
#> Maximum modularity in 10 random starts: 0.9485
#> Number of communities: 10
#> Elapsed time: 0 seconds

p <- VisQCPanel(
  obj,
  assay = NULL,
  genes_mt = "^MT-",
  genes_ribo = "^RPL|^RPS",
  group.by = "seurat_clusters",
  interactive = FALSE,
  palette = "C",
  violin_width = 0.8,
  violin_alpha = 0.3,
  box_width = 0.3,
  box_alpha = 0.5)
p