Gene cluster trend plot for visualizing gene expression trend profile in multiple samples.
Source:R/gene_cluster_trend.R
gene_cluster_trend.RdGene cluster trend plot for visualizing gene expression trend profile in multiple samples.
Arguments
- data
Dataframe: Shared DEGs of all paired comparisons in all groups expression dataframe of RNA-Seq. (1st-col: Genes, 2nd-col~n-1-col: Groups, n-col: Pathways).
- thres
Number: set the threshold for excluding genes. Default: 0.25.
- min_std
Number: set the threshold for minimum standard deviation. Default: 0.2.
- palette
Character: set the color palette to be used for plotting. Default: "PiYG", options: 'Spectral', 'BrBG', 'PiYG', 'PRGn', 'PuOr', 'RdBu', 'RdGy', 'RdYlBu', 'RdYlGn'.
- cluster_num
Number: set the number of clusters. Default: 4.
Value
Plot: Gene cluster trend plot for visualizing gene expression trend profile in multiple samples.
Examples
# 1. Library TOmicsVis package
library(TOmicsVis)
# 2. Use example dataset gene_cluster_data
data(gene_expression3)
head(gene_expression3)
#> Genes CT LT20 LT15 LT12 LT12_6
#> 1 ACAA2 39.903333 123.4366667 272.3533 359.28333 464.940000
#> 2 ACAN 14.660000 142.4800000 226.0333 316.43667 1083.523333
#> 3 ADH1 1.713333 14.8066667 12.2000 17.54333 9.343333
#> 4 AHSG 637.330000 0.0000000 0.0000 0.00000 0.000000
#> 5 ALDH2 2.490000 0.6033333 0.2700 0.13000 0.210000
#> 6 AP1S3 10.170000 27.3433333 29.1600 32.44667 44.276667
#> Pathways
#> 1 PPAR signaling pathway
#> 2 PPAR signaling pathway
#> 3 PPAR signaling pathway
#> 4 PPAR signaling pathway
#> 5 PPAR signaling pathway
#> 6 PPAR signaling pathway
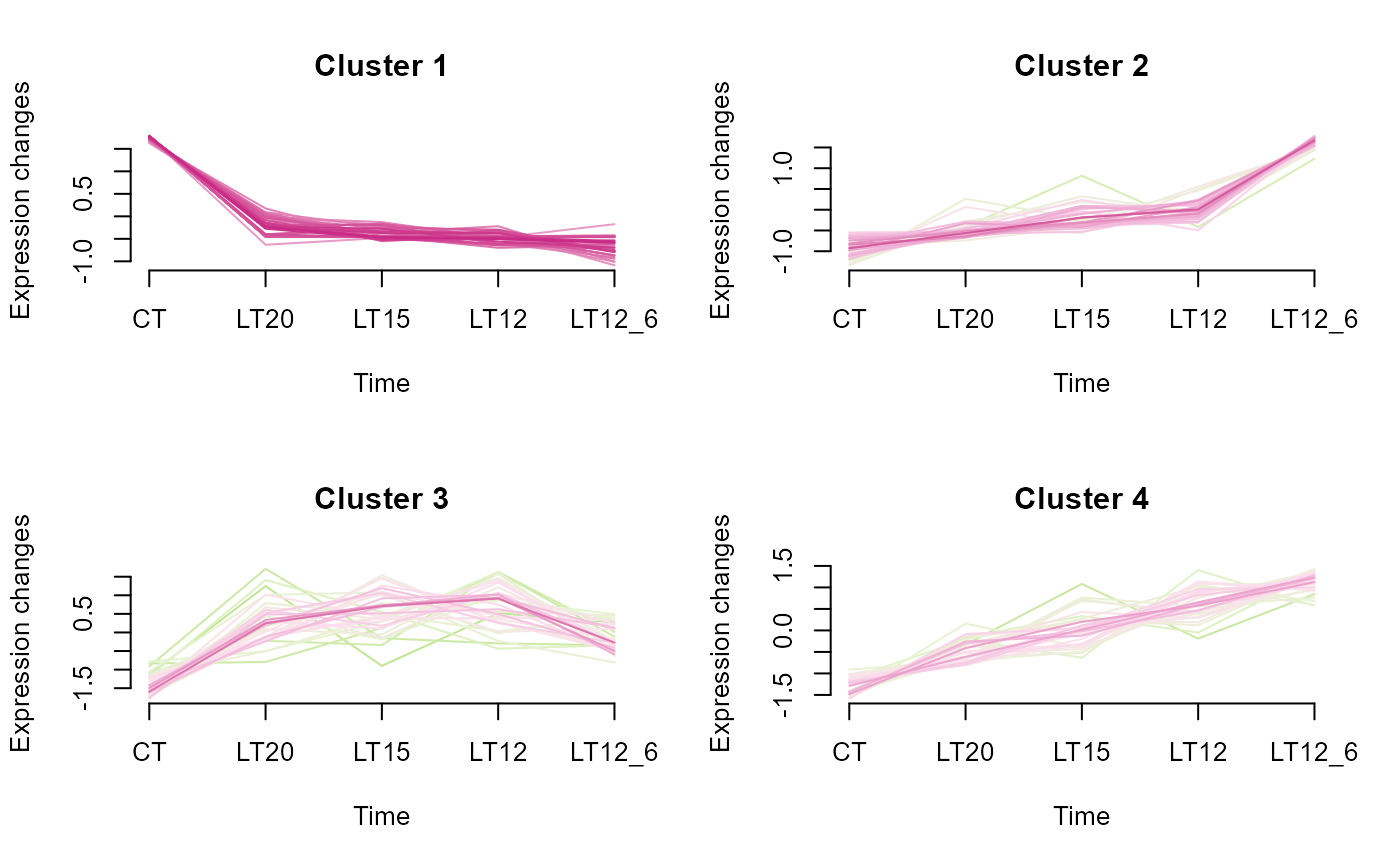
# 3. Default parameters
gene_cluster_trend(gene_expression3[,-7])
#> 0 genes excluded.
#> 0 genes excluded.
 #> NULL
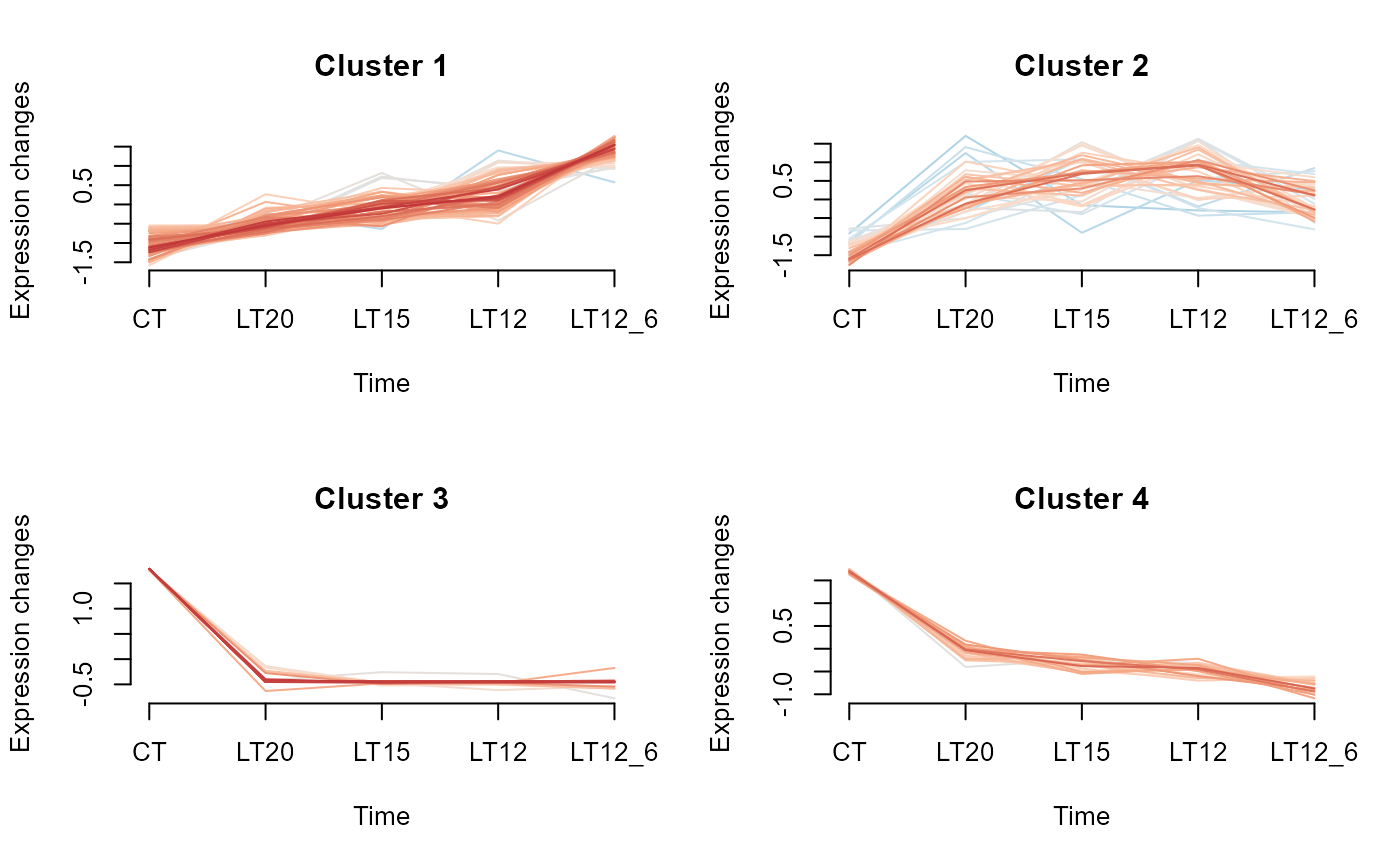
# 4. Set palette = "RdBu"
gene_cluster_trend(gene_expression3[,-7], palette = "RdBu")
#> 0 genes excluded.
#> 0 genes excluded.
#> NULL
# 4. Set palette = "RdBu"
gene_cluster_trend(gene_expression3[,-7], palette = "RdBu")
#> 0 genes excluded.
#> 0 genes excluded.
 #> NULL
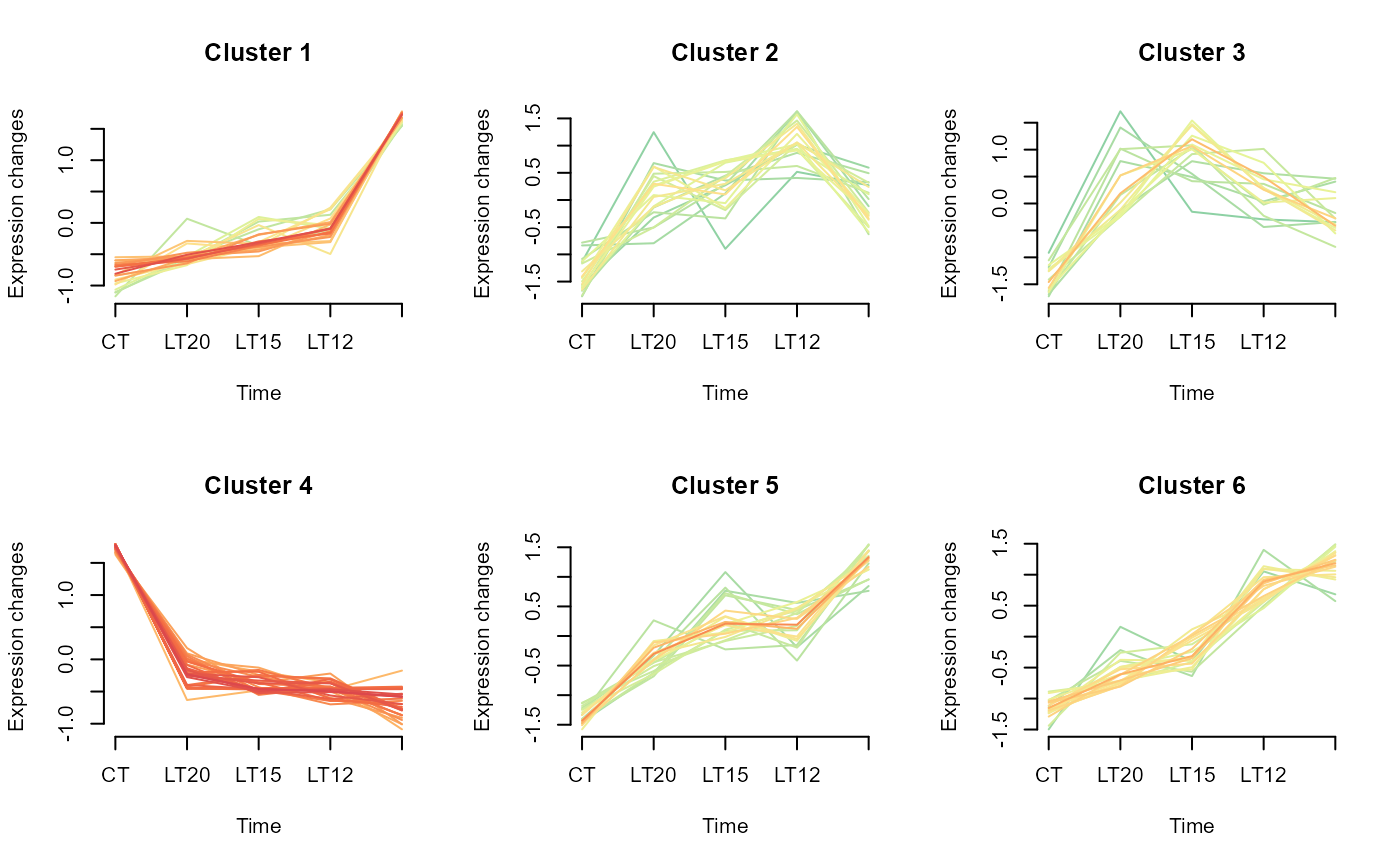
# 5. Set cluster_num = 6
gene_cluster_trend(gene_expression3[,-7], cluster_num = 6, palette = "Spectral")
#> 0 genes excluded.
#> 0 genes excluded.
#> NULL
# 5. Set cluster_num = 6
gene_cluster_trend(gene_expression3[,-7], cluster_num = 6, palette = "Spectral")
#> 0 genes excluded.
#> 0 genes excluded.
 #> NULL