Venn plot for stat common and unique gene among multiple sets.
Usage
venn_plot(
  data,
  title_size = 1.2,
  label_show = TRUE,
  label_size = 1,
  label_color = "#333333",
  border_show = TRUE,
  border_color = "#666666",
  line_type = "solid",
  line_width = 0.8,
  ellipse_shape = "circle",
  color_scheme = "Vibrant",
  fill_alpha = 0.55,
  custom_colors = NULL
)
Arguments
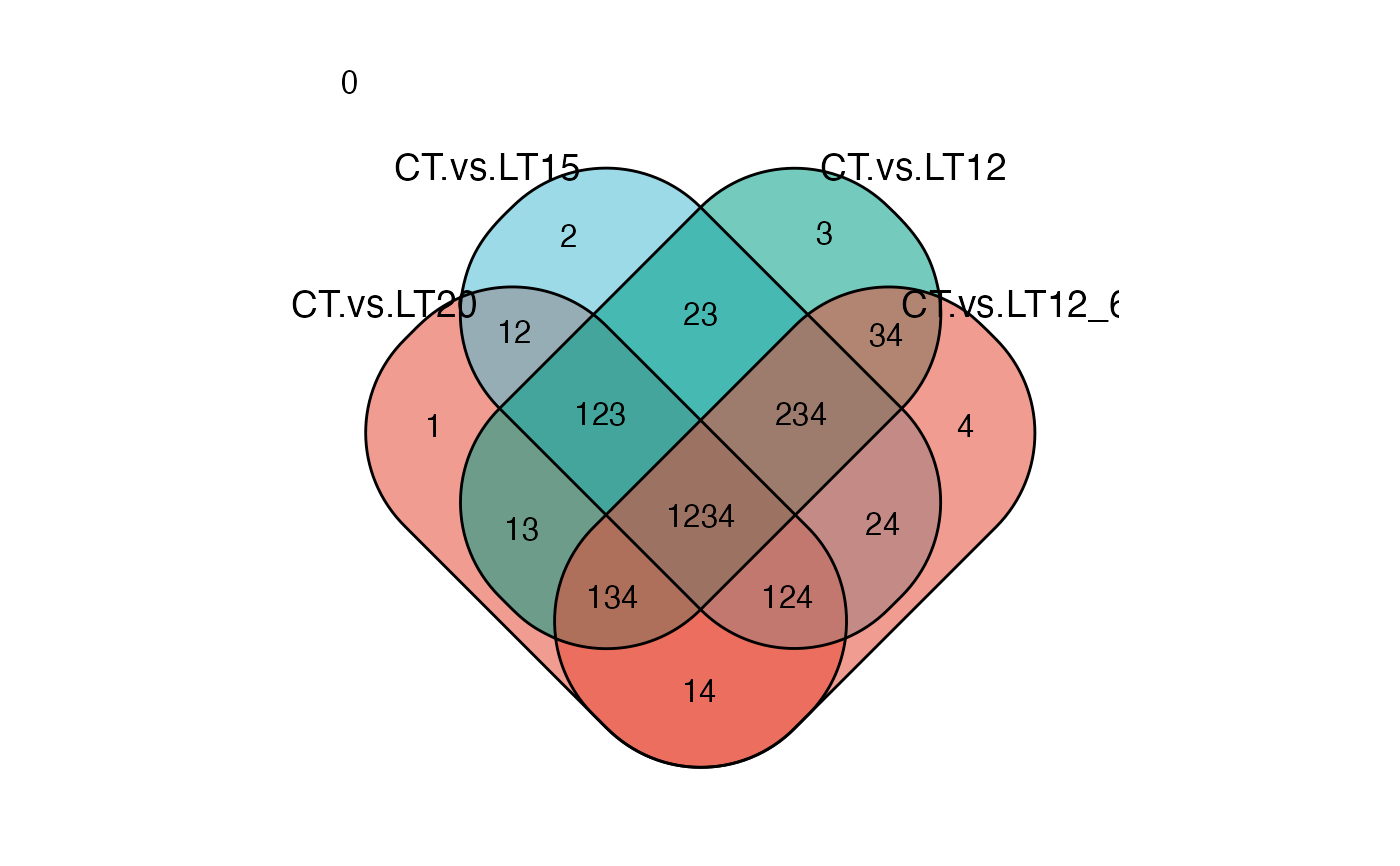
- data
Dataframe: Paired comparisons differentially expressed genes (degs) among groups (1st-col~: degs of paired comparisons).
- title_size
Numeric: sets title size. Default: 1.2, min: 0, max: NULL.
- label_show
Logical: show intersection labels. Default: TRUE, options: TRUE, FALSE.
- label_size
Numeric: intersection labels size. Default: 1, min: 0, max: NULL.
- label_color
Character: label text color. Default: "#333333", options: hex color code.
- border_show
Logical: show border line. Default: TRUE, options: TRUE, FALSE.
- border_color
Character: ellipse border color. Default: "#666666", options: hex color code.
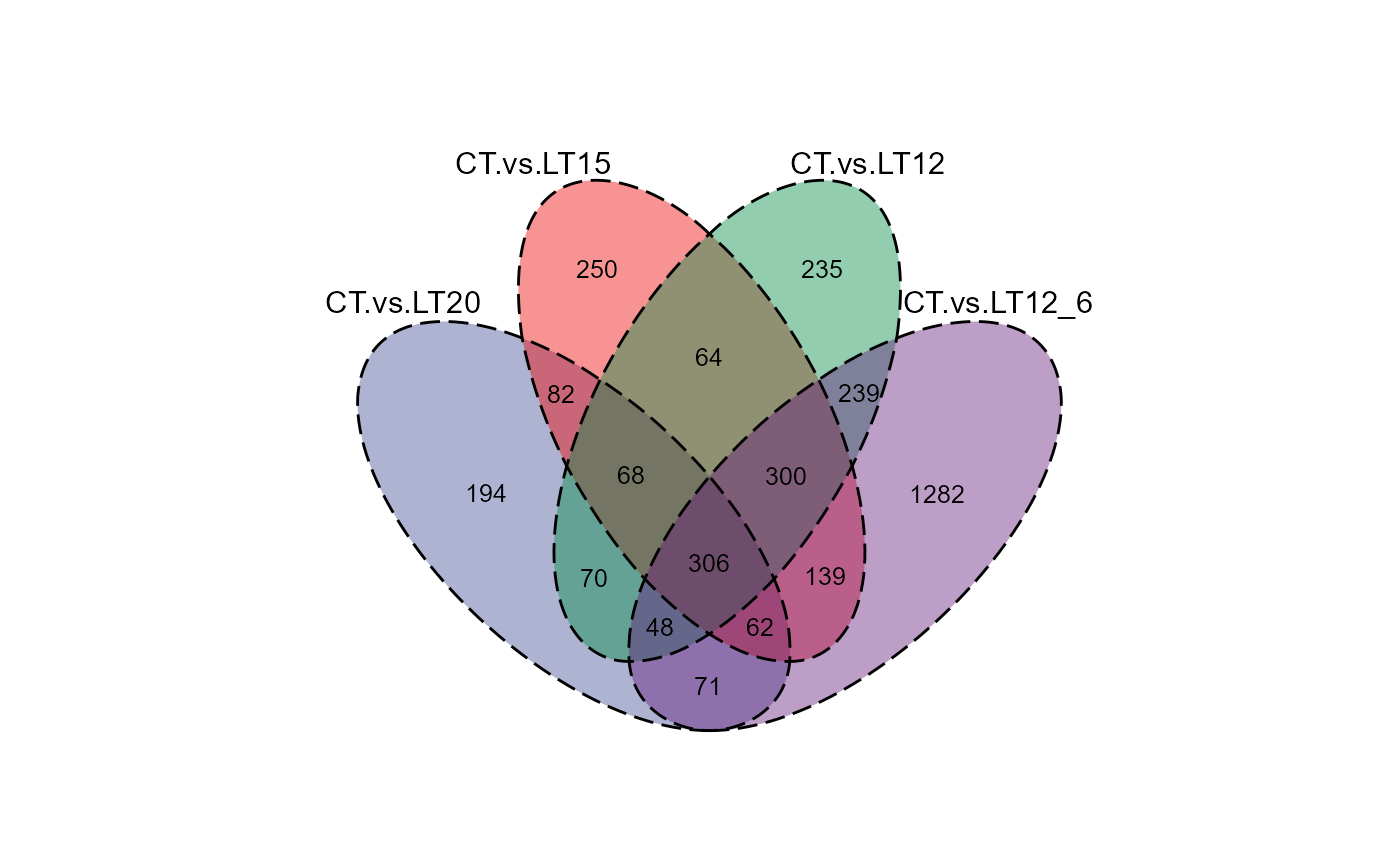
- line_type
Character: ellipse border line type. Default: "solid", options: "blank", "solid", "dashed", "dotted", "dotdash", "longdash", "twodash".
- line_width
Numeric: border line width. Default: 0.8, min: 0, max: NULL.
- ellipse_shape
Character: ellipse shape. Default: "circle", options: "circle", "ellipse".
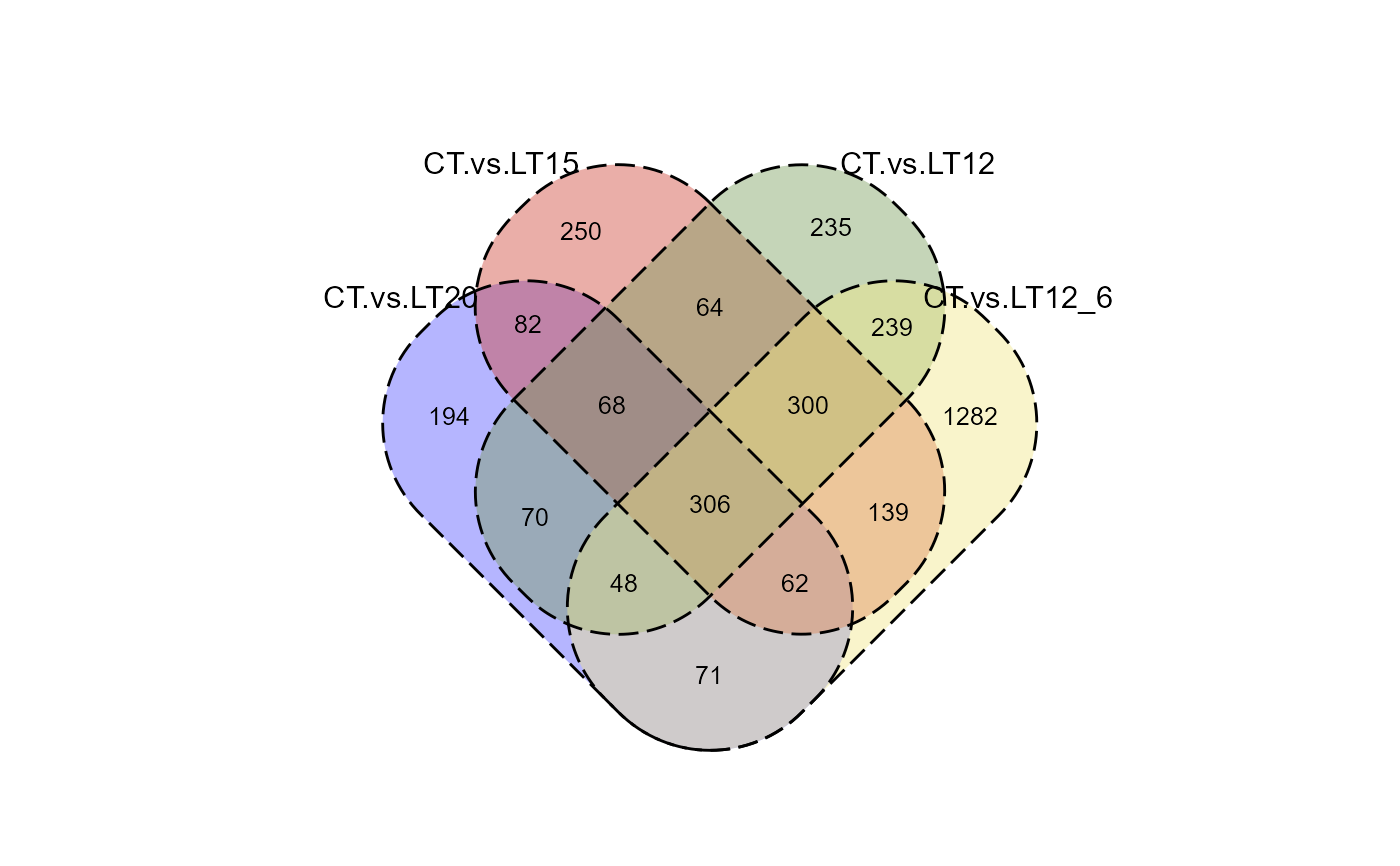
- color_scheme
Character: venn color scheme. Default: "Vibrant", options: "Vibrant", "Pastel", "Ocean", "Sunset", "Forest", "Neon", "Candy", "Earth", "Wine", "Sci_AAAS", "Sci_NPG", "Sci_Simpsons", "Sci_JAMA", "Sci_GSEA", "Sci_Lancet", "Sci_Futurama", "Sci_JCO", "Sci_NEJM", "Sci_IGV", "Sci_UCSC", "Sci_D3", "Sci_Material".
- fill_alpha
Numeric: fill color alpha (transparency). Default: 0.55, min: 0.00, max: 1.00.
- custom_colors
Character vector: custom colors for sets (overrides color_scheme).
Examples
# 1. Library TOmicsVis package
library(TOmicsVis)
# 2. Use example dataset
data(degs_lists)
head(degs_lists)
#> CT.vs.LT20 CT.vs.LT15 CT.vs.LT12 CT.vs.LT12_6
#> 1 transcript_9024 transcript_4738 transcript_9956 transcript_10354
#> 2 transcript_604 transcript_6050 transcript_7601 transcript_2959
#> 3 transcript_3912 transcript_1039 transcript_5960 transcript_5919
#> 4 transcript_8676 transcript_1344 transcript_3240 transcript_2395
#> 5 transcript_8832 transcript_3069 transcript_10224 transcript_9881
#> 6 transcript_74 transcript_9809 transcript_3151 transcript_8836
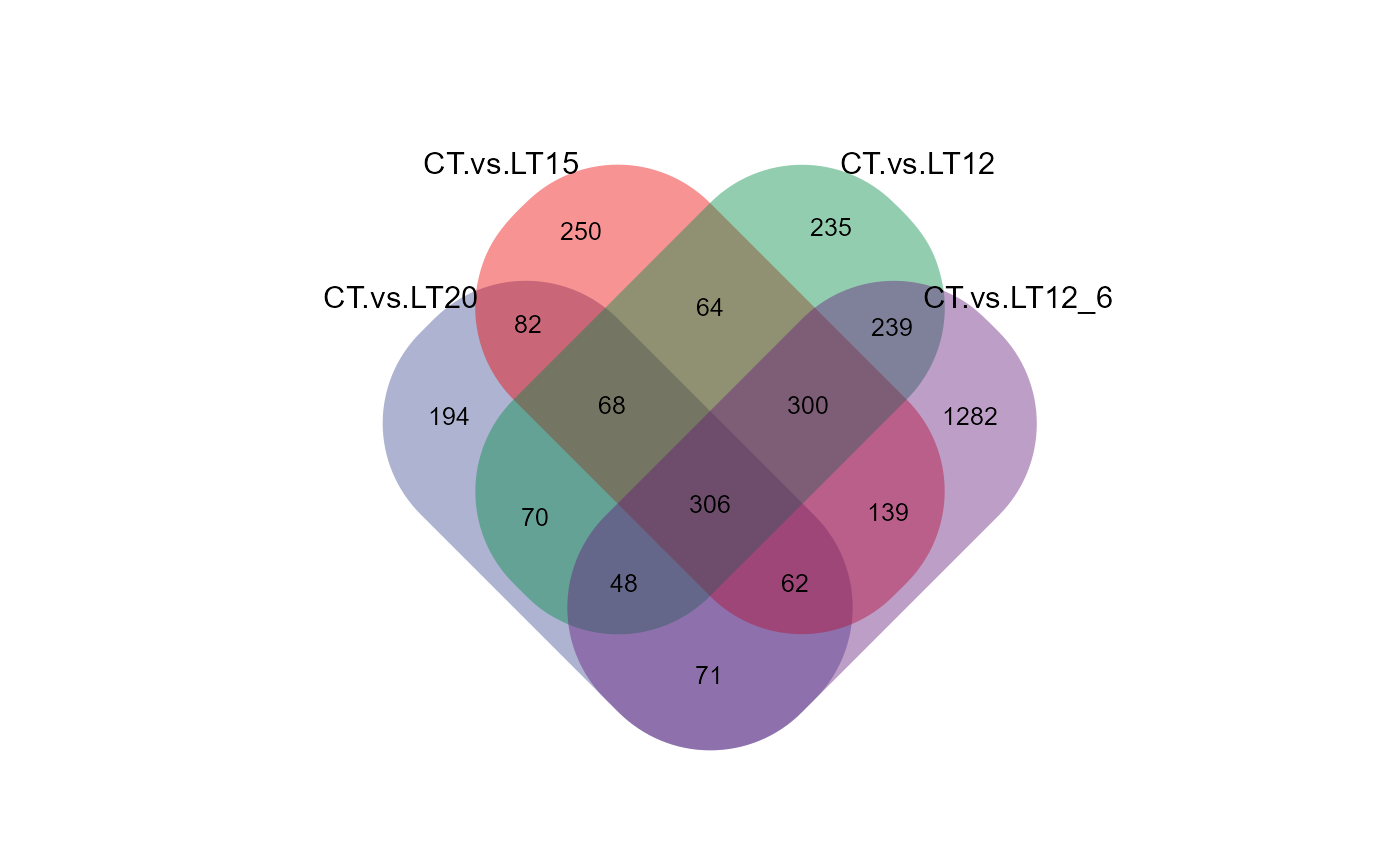
# 3. Default parameters (Vibrant theme)
venn_plot(degs_lists)
 # 4. Pastel soft colors
venn_plot(degs_lists, color_scheme = "Pastel")
# 4. Pastel soft colors
venn_plot(degs_lists, color_scheme = "Pastel")
 # 5. Ocean theme
venn_plot(degs_lists, color_scheme = "Ocean")
# 5. Ocean theme
venn_plot(degs_lists, color_scheme = "Ocean")
 # 6. Sunset warm colors
venn_plot(degs_lists, color_scheme = "Sunset")
# 6. Sunset warm colors
venn_plot(degs_lists, color_scheme = "Sunset")
 # 7. Custom colors
venn_plot(degs_lists, custom_colors = c("#E64B35FF", "#4DBBD5FF", "#00A087FF"))
# 7. Custom colors
venn_plot(degs_lists, custom_colors = c("#E64B35FF", "#4DBBD5FF", "#00A087FF"))